Hierarchy
Ext.chart.axis.AbstractExt.chart.axis.AxisExt.chart.axis.Numeric
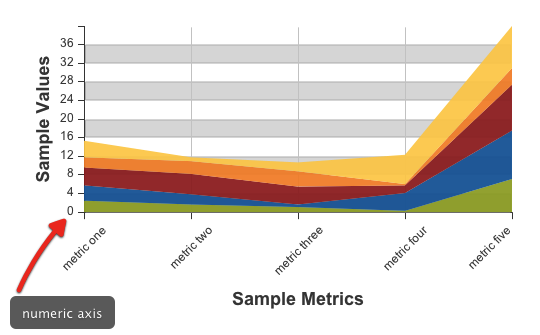
An axis to handle numeric values. This axis is used for quantitative data as opposed to the category axis. You can set mininum and maximum values to the axis so that the values are bound to that. If no values are set, then the scale will auto-adjust to the values.
For example:
var store = Ext.create('Ext.data.JsonStore', {
     fields: ['name', 'data1', 'data2', 'data3', 'data4', 'data5'],
     data: [
         {'name':'metric one', 'data1':10, 'data2':12, 'data3':14, 'data4':8, 'data5':13},
         {'name':'metric two', 'data1':7, 'data2':8, 'data3':16, 'data4':10, 'data5':3},
         {'name':'metric three', 'data1':5, 'data2':2, 'data3':14, 'data4':12, 'data5':7},
         {'name':'metric four', 'data1':2, 'data2':14, 'data3':6, 'data4':1, 'data5':23},
         {'name':'metric five', 'data1':27, 'data2':38, 'data3':36, 'data4':13, 'data5':33}
     ]
});

Ext.create('Ext.chart.Chart', {
    renderTo: Ext.getBody(),
    width: 500,
    height: 300,
    store: store,
    axes: [{
        type: 'Numeric',
        grid: true,
        position: 'left',
        fields: ['data1', 'data2', 'data3', 'data4', 'data5'],
        title: 'Sample Values',
        grid: {
            odd: {
                opacity: 1,
                fill: '#ddd',
                stroke: '#bbb',
                'stroke-width': 1
            }
        },
        minimum: 0,
        adjustMinimumByMajorUnit: 0
    }, {
        type: 'Category',
        position: 'bottom',
        fields: ['name'],
        title: 'Sample Metrics',
        grid: true,
        label: {
            rotate: {
                degrees: 315
            }
        }
    }],
    series: [{
        type: 'area',
        highlight: false,
        axis: 'left',
        xField: 'name',
        yField: ['data1', 'data2', 'data3', 'data4', 'data5'],
        style: {
            opacity: 0.93
        }
    }]
});
In this example we create an axis of Numeric type. We set a minimum value so that even if all series have values greater than zero, the grid starts at zero. We bind the axis onto the left part of the surface by setting position to left. We bind three different store fields to this axis by setting fields to an array. We set the title of the axis to Number of Hits by using the title property. We use a grid configuration to set odd background rows to a certain style and even rows to be transparent/ignored.
Config Options
Other Configs
If minimum and maximum are specified it forces the number of major ticks to the specified value.
If minimum and maximum are specified it forces the number of major ticks to the specified value.
The number of small ticks between two major ticks. Default is zero.
The number of small ticks between two major ticks. Default is zero.
Properties
Indicates whether to extend maximum beyond data's maximum to the nearest majorUnit.
Indicates whether to extend maximum beyond data's maximum to the nearest majorUnit.
Indicates whether to extend the minimum beyond data's minimum to the nearest majorUnit.
Indicates whether to extend the minimum beyond data's minimum to the nearest majorUnit.
The number of decimals to round the value to. Default's 2.
The number of decimals to round the value to. Default's 2.
The maximum value drawn by the axis. If not set explicitly, the axis maximum will be calculated automatically.
The maximum value drawn by the axis. If not set explicitly, the axis maximum will be calculated automatically.
The minimum value drawn by the axis. If not set explicitly, the axis minimum will be calculated automatically.
The minimum value drawn by the axis. If not set explicitly, the axis minimum will be calculated automatically.
Indicates the position of the axis relative to the chart
Indicates the position of the axis relative to the chart
Methods
Renders the axis into the screen and updates it's position.
Renders the axis into the screen and updates it's position.
Parameters
- init : Object
Returns
- void