Hierarchy
Ext.chart.axis.AbstractExt.chart.axis.AxisExt.chart.axis.Category
A type of axis that displays items in categories. This axis is generally used to display categorical information like names of items, month names, quarters, etc. but no quantitative values. For that other type of information Number axis are more suitable.
As with other axis you can set the position of the axis and its title. For example:
var store = Ext.create('Ext.data.JsonStore', {
fields: ['name', 'data1', 'data2', 'data3', 'data4', 'data5'],
data: [
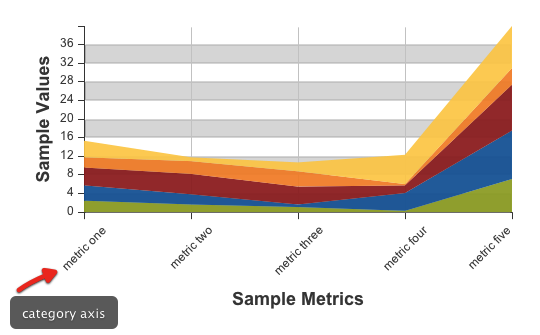
{'name':'metric one', 'data1':10, 'data2':12, 'data3':14, 'data4':8, 'data5':13},
{'name':'metric two', 'data1':7, 'data2':8, 'data3':16, 'data4':10, 'data5':3},
{'name':'metric three', 'data1':5, 'data2':2, 'data3':14, 'data4':12, 'data5':7},
{'name':'metric four', 'data1':2, 'data2':14, 'data3':6, 'data4':1, 'data5':23},
{'name':'metric five', 'data1':27, 'data2':38, 'data3':36, 'data4':13, 'data5':33}
]
});
Ext.create('Ext.chart.Chart', {
renderTo: Ext.getBody(),
width: 500,
height: 300,
store: store,
axes: [{
type: 'Numeric',
grid: true,
position: 'left',
fields: ['data1', 'data2', 'data3', 'data4', 'data5'],
title: 'Sample Values',
grid: {
odd: {
opacity: 1,
fill: '#ddd',
stroke: '#bbb',
'stroke-width': 1
}
},
minimum: 0,
adjustMinimumByMajorUnit: 0
}, {
type: 'Category',
position: 'bottom',
fields: ['name'],
title: 'Sample Metrics',
grid: true,
label: {
rotate: {
degrees: 315
}
}
}],
series: [{
type: 'area',
highlight: false,
axis: 'left',
xField: 'name',
yField: ['data1', 'data2', 'data3', 'data4', 'data5'],
style: {
opacity: 0.93
}
}]
});
In this example with set the category axis to the bottom of the surface, bound the axis to the name property and set as title Month of the Year.
Config Options
Other Configs
If minimum and maximum are specified it forces the number of major ticks to the specified value.
If minimum and maximum are specified it forces the number of major ticks to the specified value.
The number of small ticks between two major ticks. Default is zero.
The number of small ticks between two major ticks. Default is zero.
Properties
Indicates whether or not to calculate the number of categories (ticks and labels) when there is not enough room to display all labels on the axis. If set to true, the axis will determine the number of categories to plot. If not, all categories will be plotted.
Methods
Renders the axis into the screen and updates it's position.
Renders the axis into the screen and updates it's position.
Parameters
- init : Object
Returns
- void